

Data visualization is a powerful tool that transforms raw data into understandable and actionable insights. For economic development, this is especially critical. By presenting complex information in visual formats like charts, graphs, and maps, stakeholders can quickly identify trends, opportunities, and challenges that would otherwise be buried in spreadsheets and reports.

Enhanced Understanding and Decision-Making
Visualizing data allows decision-makers to grasp key concepts more easily. Instead of sifting through dense tables, they can see patterns and correlations at a glance. For example, a heat map showing job growth by sector can immediately highlight which industries are thriving and where resources should be allocated. This leads to more informed and strategic decisions.
Effective Communication with Stakeholders
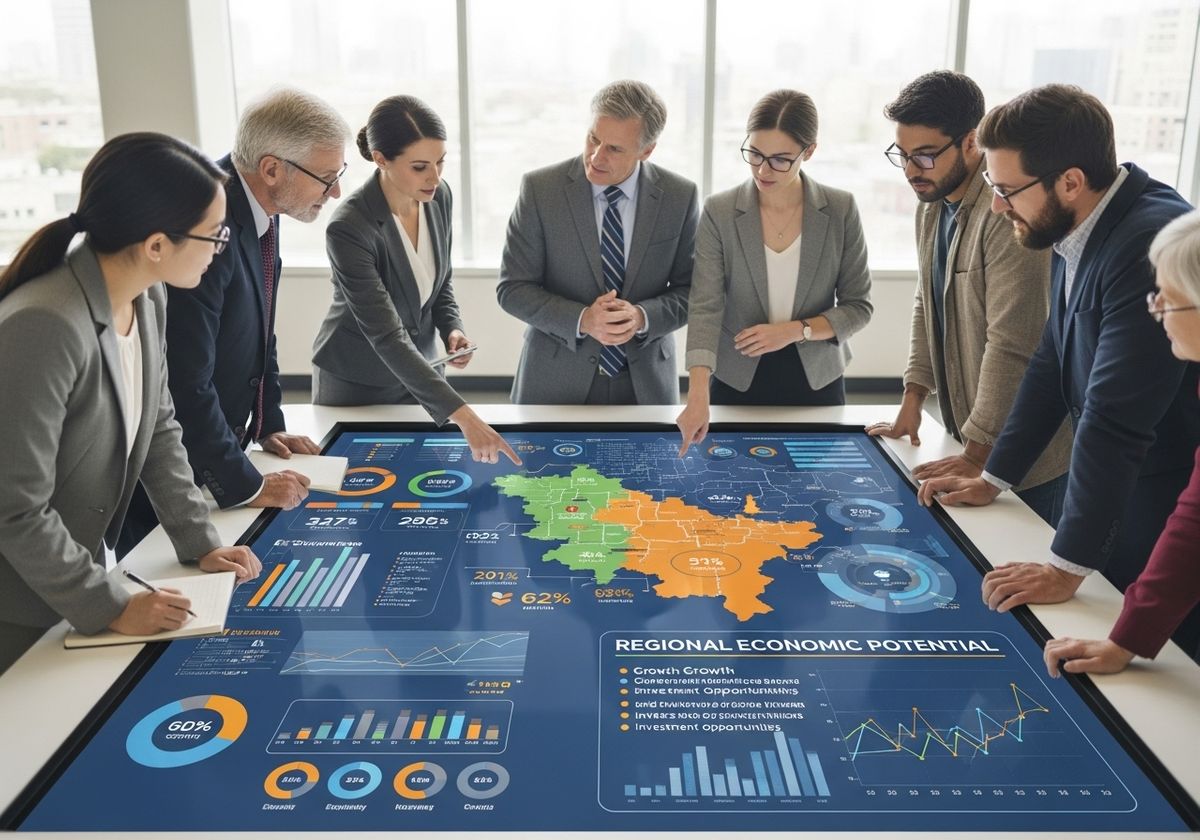
Economic development involves numerous stakeholders, including government officials, business leaders, and community members. Data visualization facilitates clear and concise communication among these groups. A well-designed infographic can tell a compelling story about a region's economic potential, attracting investment and fostering collaboration. Visuals transcend technical jargon, ensuring everyone is on the same page.
Identifying Trends and Opportunities
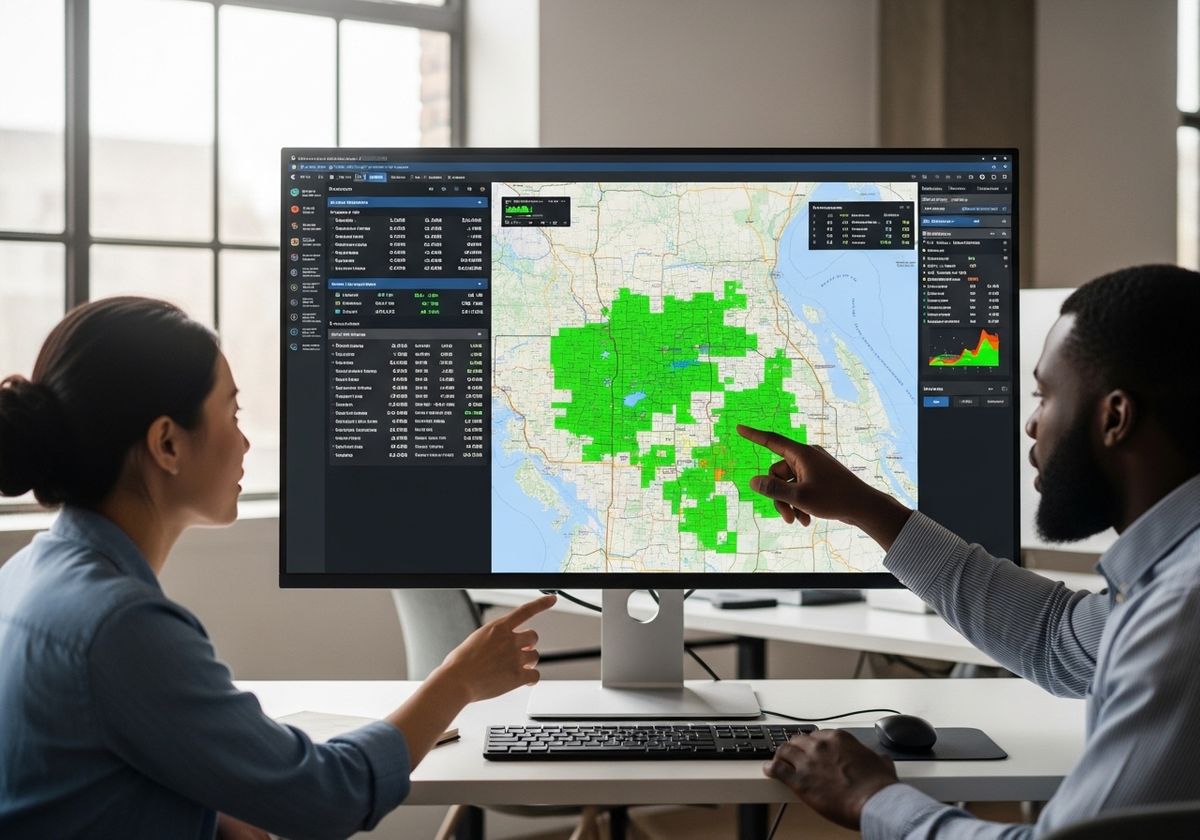
Visual representations of data can reveal emerging trends and opportunities that might otherwise go unnoticed. For instance, visualizing demographic data can help identify areas with a growing workforce, making them attractive for businesses looking to expand. Similarly, visualizing infrastructure data can highlight areas where investment is needed to support economic growth. Geographic information system mapping is particularly useful here, as it can overlay various data layers to provide a comprehensive view of an area's assets and challenges.

Improved Transparency and Accountability
Data visualization promotes transparency by making information accessible to the public. When citizens can see how their tax dollars are being used and the impact of economic development initiatives, it fosters trust and accountability. Interactive dashboards that allow users to explore data on their own further empower communities and encourage participation in the development process.

Applications of Data Visualization in Economic Development
Several specific applications of data visualization can drive economic growth:
Community Profiles: Visualizing key demographic, economic, and social indicators to showcase a community's strengths and opportunities.
Site Selection: Using geographic information system mapping to identify optimal locations for businesses based on factors like transportation, utilities, and workforce availability.
Investment Attraction: Creating compelling visuals that highlight a region's competitive advantages and investment potential. This can include 3d map rendering and terrain modeling to provide a realistic view of available sites.
Performance Monitoring: Tracking progress towards economic development goals and communicating results to stakeholders through dashboards and reports.
In summary, data visualization is an indispensable tool for economic development. It enhances understanding, facilitates communication, identifies opportunities, and promotes transparency. By leveraging the power of visual data, communities can make more informed decisions, attract investment, and create a more prosperous future. At Flyer View Group, LLC, we specialize in Telling Your Story Through Data, Maps, Motion & Graphics. Contact us today to learn more about how our comprehensive, integrated marketing firm, our products such as Community Profiles, GIS/Mapping Services, and other services can help you unlock the economic potential of your community. Explore our website to discover how our expertise can advance your economic development initiatives.