
In today's dynamic economic landscape, identifying promising investment opportunities and burgeoning development zones is crucial for strategic decision-making. One of the most effective tools for visualizing and analyzing complex spatial data is the heat map. By leveraging the power of heat maps, investors, developers, and urban planners can gain valuable insights into geographic trends, investment clusters, and potential hot zones.
Understanding Heat Maps
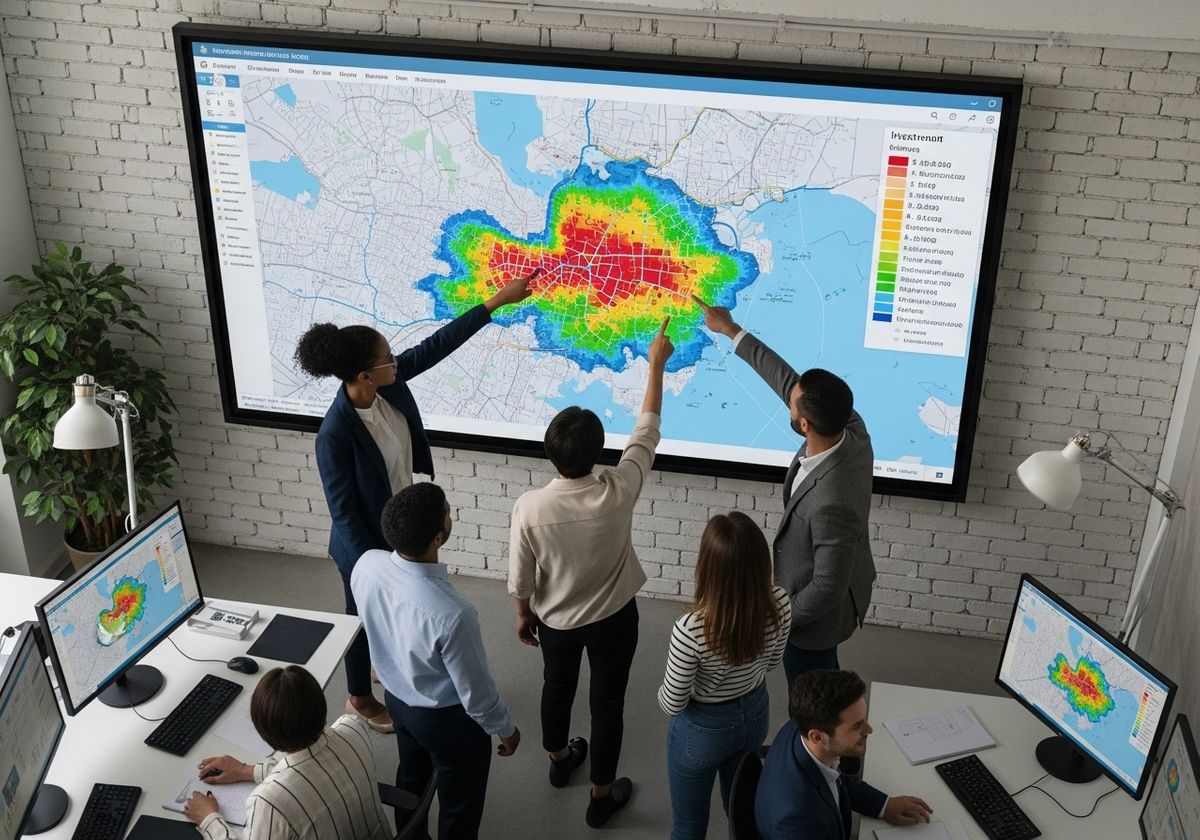
Heat maps are graphical representations of data where values are depicted using colors. Typically, a color spectrum is used to indicate the intensity of a particular variable, with warmer colors (e.g., red, orange) representing higher values and cooler colors (e.g., blue, green) representing lower values. In the context of investment and development, heat maps can be used to visualize a wide range of data, such as property values, population density, income levels, crime rates, and infrastructure development.
Identifying Investment Clusters
One of the key applications of heat maps is identifying areas with a high concentration of investment activity. By mapping data on real estate transactions, business investments, or infrastructure projects, heat maps can reveal emerging investment clusters. These clusters may indicate areas with strong economic growth potential, favorable business environments, or attractive investment incentives. Investors can use this information to target their resources and capitalize on emerging opportunities.
Pinpointing Development Hot Zones
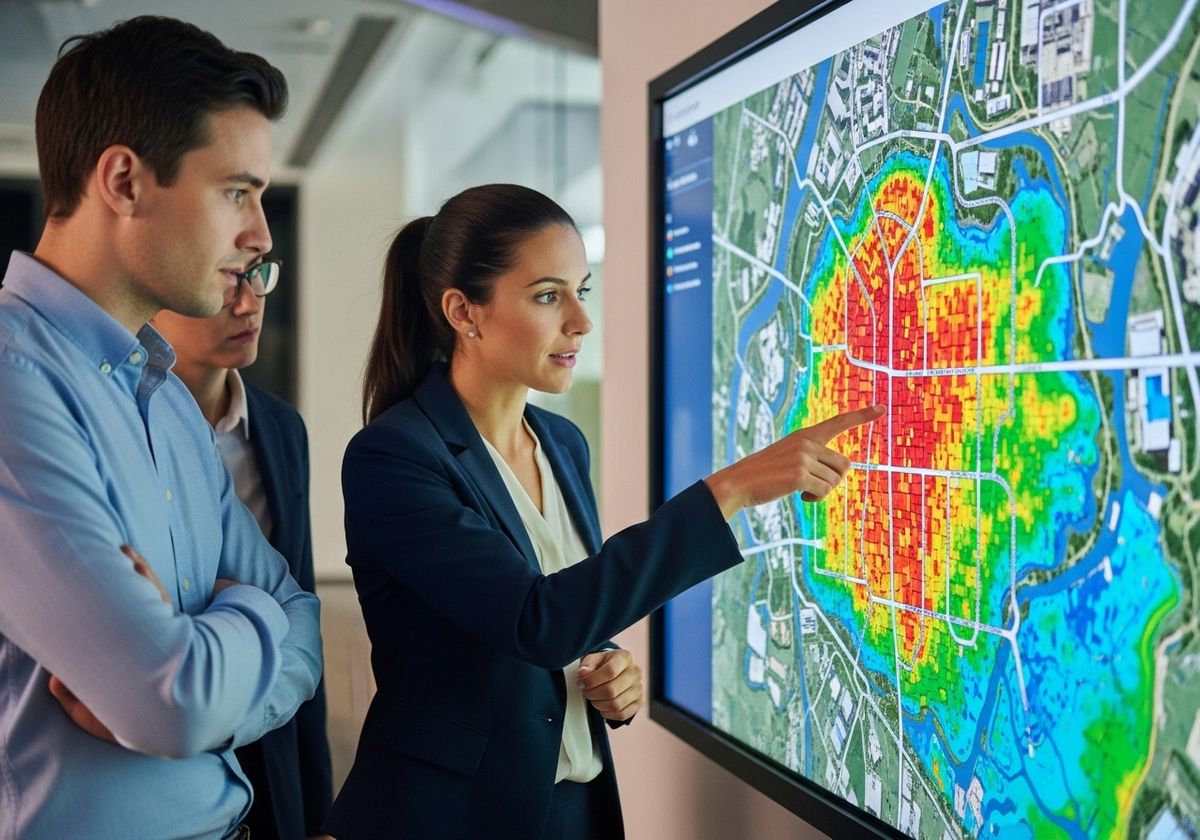
Heat maps are also invaluable for pinpointing development hot zones – areas experiencing rapid growth and transformation. By mapping data on population growth, new construction, zoning changes, and infrastructure improvements, heat maps can highlight areas ripe for development. These hot zones may present opportunities for residential, commercial, or mixed-use development, depending on the specific characteristics of the area.
Leveraging Geographic Information Services (GIS)
To create effective heat maps for investment and development analysis, it's essential to leverage Geographic Information Services (GIS). A GIS mapping system allows users to integrate and analyze various spatial data layers, creating comprehensive visualizations of geographic trends. GIS software can also be used to perform spatial analysis, such as identifying correlations between different variables or predicting future development patterns. By combining the power of heat maps with GIS capabilities, investors and developers can gain a deeper understanding of the urban landscape.
Advanced Techniques: 3D Map Rendering and Interactive Maps
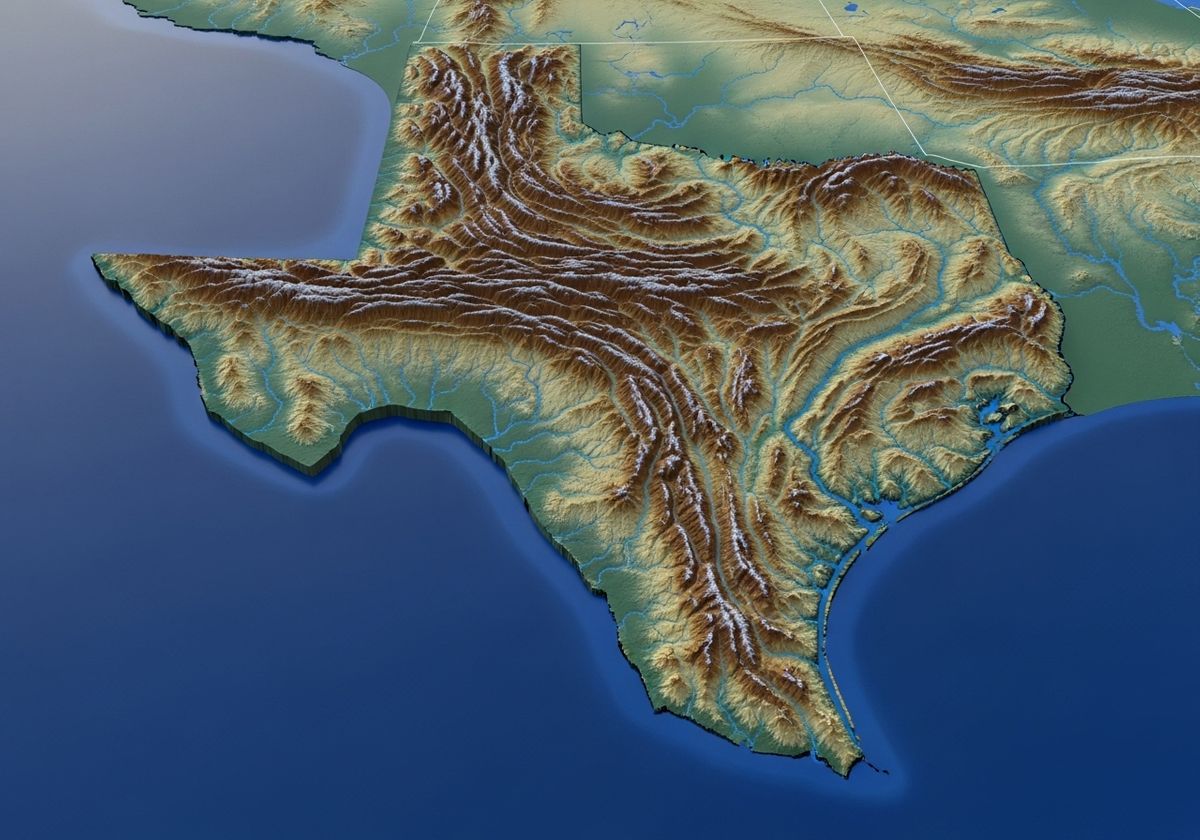
Beyond traditional heat maps, advanced techniques like 3D map rendering and interactive maps can provide even more sophisticated insights. 3D map rendering allows users to visualize data in a three-dimensional space, providing a more realistic and intuitive representation of the urban environment. Interactive map for website solutions, on the other hand, enables users to explore data dynamically, zoom in on specific areas, and overlay different data layers. These advanced techniques can be particularly useful for visualizing complex projects or communicating findings to stakeholders.
Heat maps are powerful tools for identifying investment clusters and development hot zones. By visualizing complex spatial data, heat maps enable investors, developers, and urban planners to make informed decisions and capitalize on emerging opportunities. Leveraging geographic information services, 3D map rendering, and interactive maps can further enhance the effectiveness of heat maps, providing a comprehensive understanding of the urban landscape. At Flyer View Group, LLC, we offer comprehensive solutions that transform complex data into clear, actionable insights. Explore our Community Profiles and GIS/Mapping Services to discover how we can help you identify and capitalize on key market opportunities. Contact us today to learn more about how our services can drive your success.